Prediction model for graft failure after liver transplantation-chatGPT coded program for Windows
Author
jsrrules@gmail.com
Date
2025-02-03 13:25
Views
434
Abstract
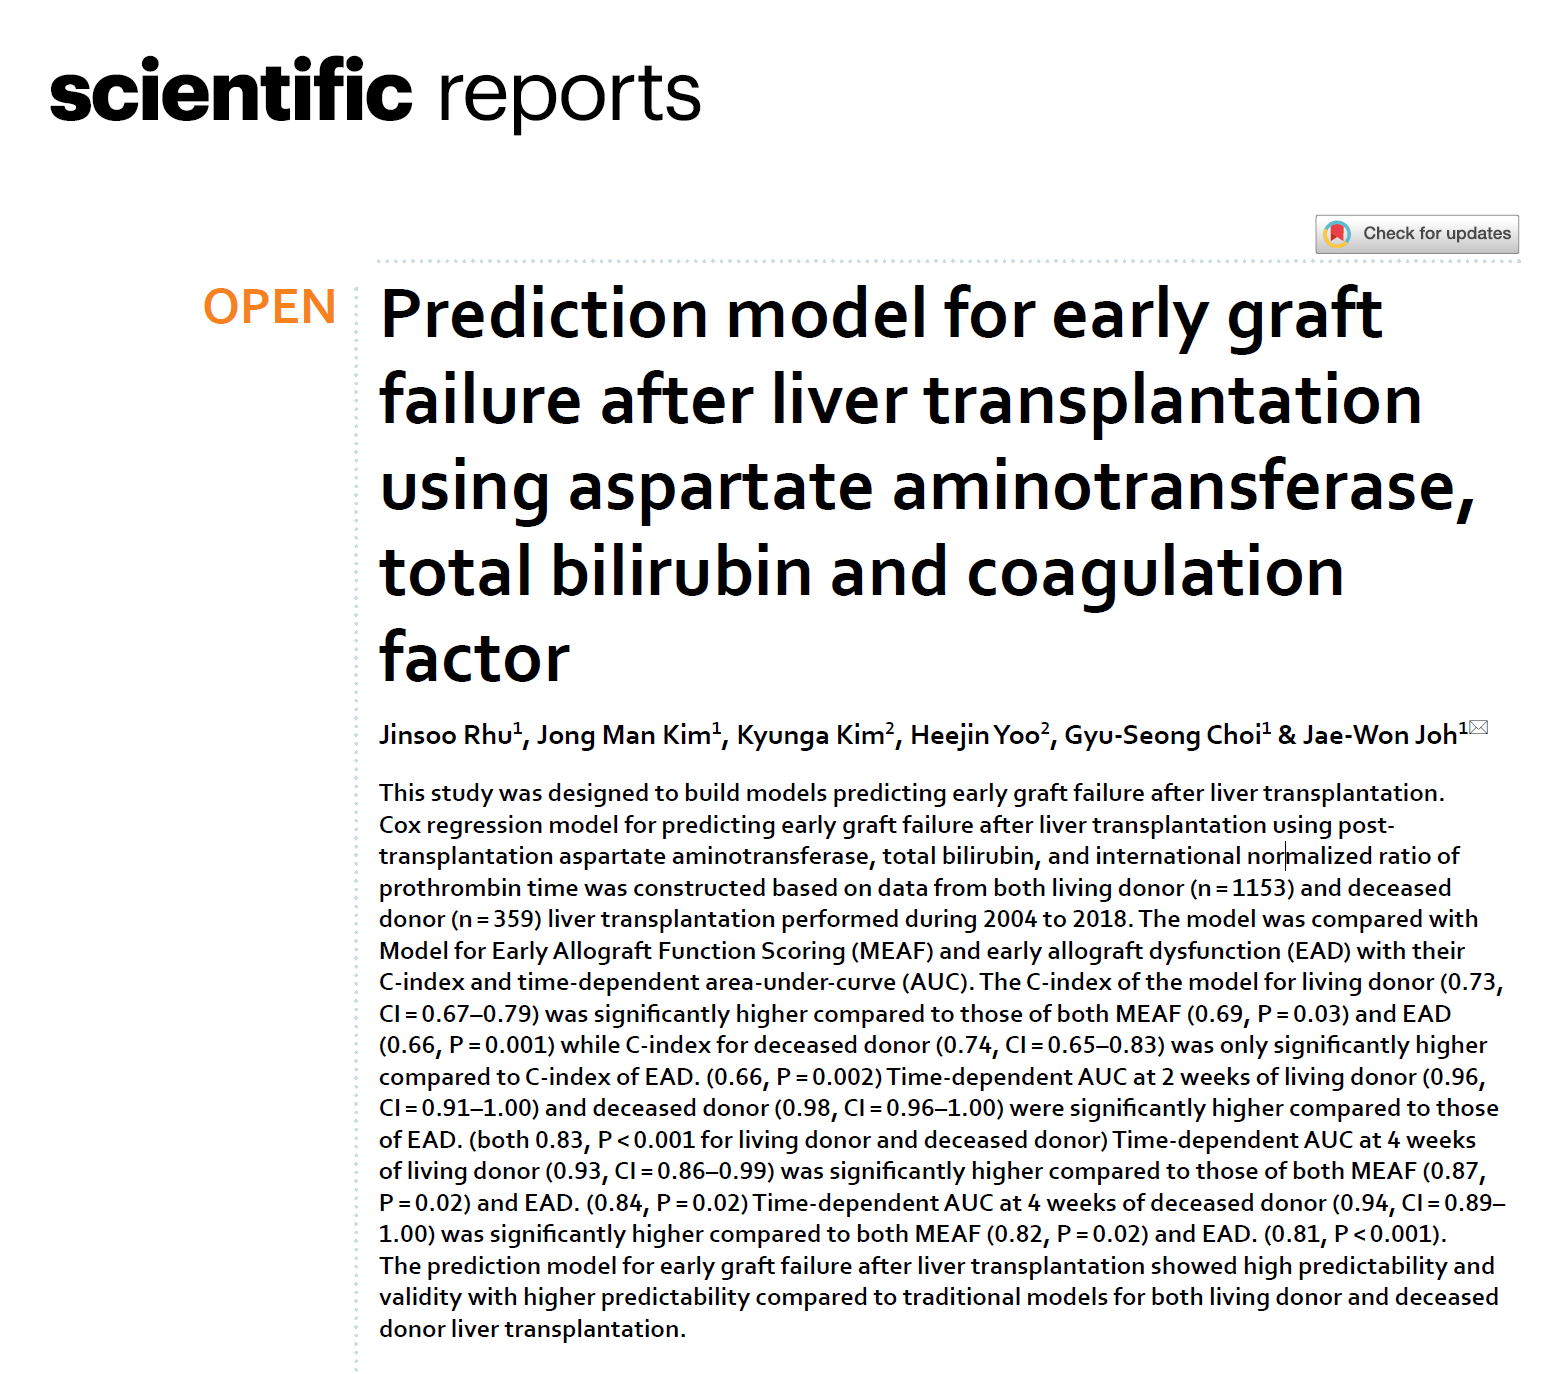
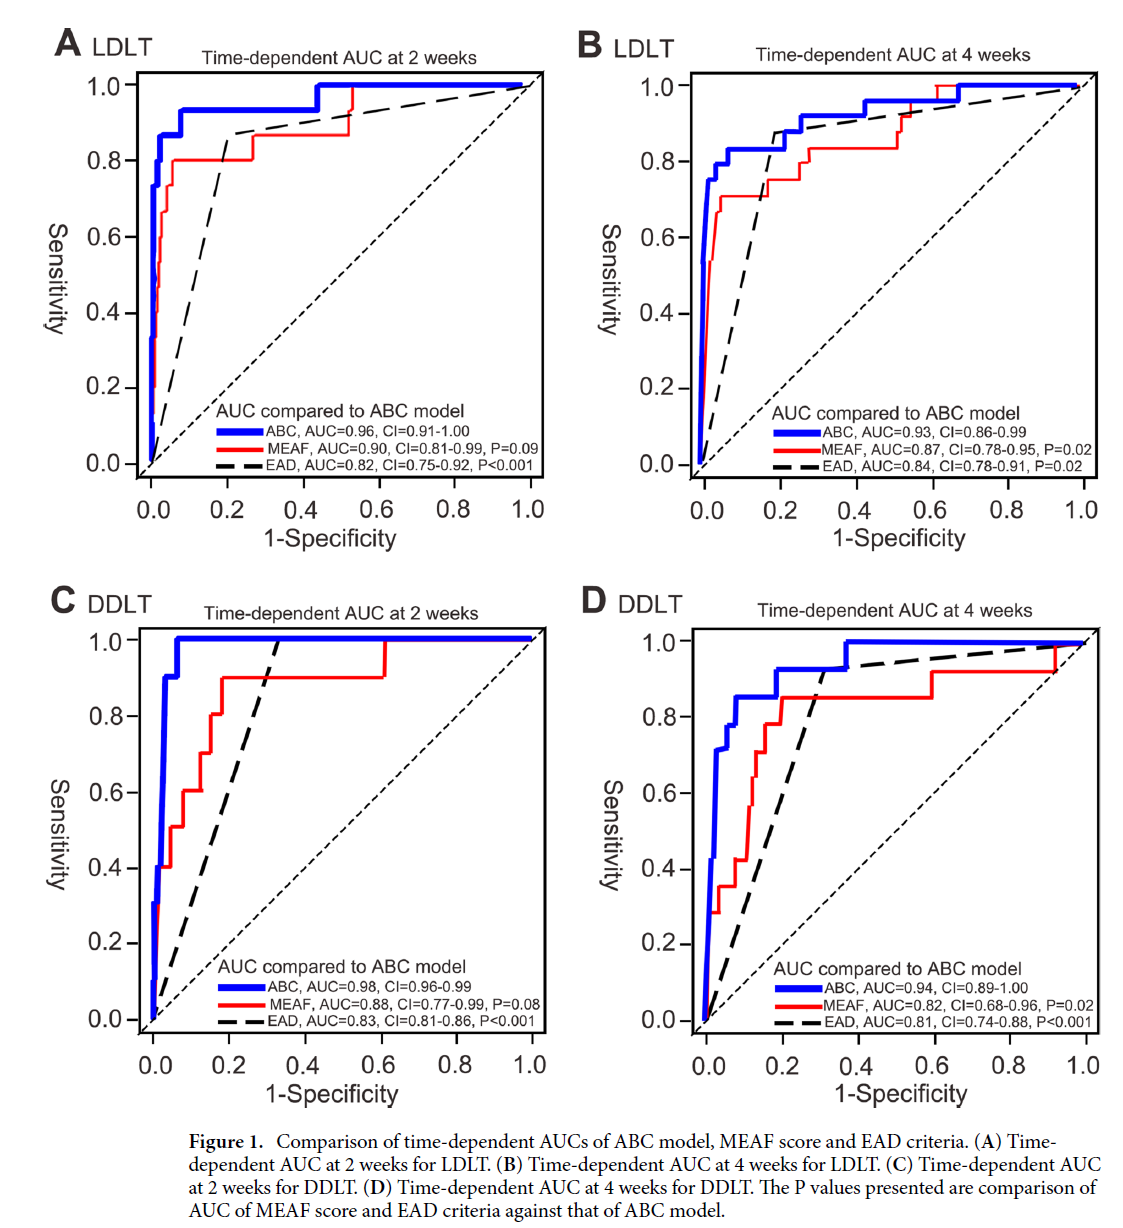
This study was designed to build models predicting early graft failure after liver transplantation. Cox regression model for predicting early graft failure after liver transplantation using posttransplantation aspartate aminotransferase, total bilirubin, and international normalized ratio of prothrombin time was constructed based on data from both living donor (n = 1153) and deceased donor (n = 359) liver transplantation performed during 2004 to 2018. The model was compared with Model for Early Allograft Function Scoring (MEAF) and early allograft dysfunction (EAD) with their C-index and time-dependent area-under-curve (AUC). The C-index of the model for living donor (0.73, CI = 0.67–0.79) was significantly higher compared to those of both MEAF (0.69, P = 0.03) and EAD (0.66, P = 0.001) while C-index for deceased donor (0.74, CI = 0.65–0.83) was only significantly higher compared to C-index of EAD. (0.66, P = 0.002) Time-dependent AUC at 2 weeks of living donor (0.96, CI = 0.91–1.00) and deceased donor (0.98, CI = 0.96–1.00) were significantly higher compared to those of EAD. (both 0.83, P < 0.001 for living donor and deceased donor) Time-dependent AUC at 4 weeks of living donor (0.93, CI = 0.86–0.99) was significantly higher compared to those of both MEAF (0.87, P = 0.02) and EAD. (0.84, P = 0.02) Time-dependent AUC at 4 weeks of deceased donor (0.94, CI = 0.89– 1.00) was significantly higher compared to both MEAF (0.82, P = 0.02) and EAD. (0.81, P < 0.001). The prediction model for early graft failure after liver transplantation showed high predictability and validity with higher predictability compared to traditional models for both living donor and deceased donor liver transplantation.
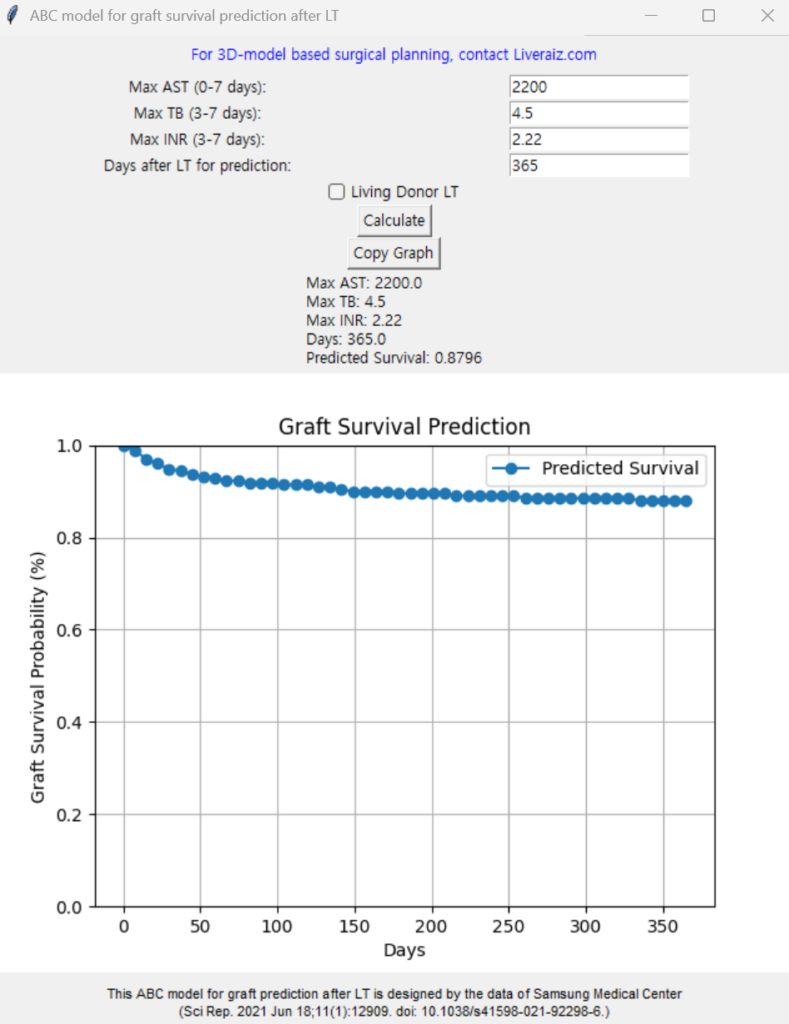
This program was coded by chatGPT implementing the graft survival prediction model developed by the article. ABC model stands for AST, Bilirubin, Coagulation factor.
You can put maximum AST level during 0-7 days post-LT, maximum Total bilirubin level during 3-7 days, maximum INR level during 3-7 days. The day after LT is for calculating the probability of survival after LT. It shows you the exact number as well as the survival curve.
Use it freely and when writing a paper, please make a citation on the article.
📥 다운로드 횟수: 50회